


I covered the vertical column graphs in detail previously. We can also use CSS to draw bar graphs that are oriented horizontally. For this type of graph, I wrote a new class called "horizontalgraph" and made the code flexible by specifying the height of the graph from the markup.
Based on the number of bars that we have, I repeat a cross section of the 253 pixel wide and 44 pixel high blue graph "paper" vertically:

To compute the total height of your graph: each graph section being 44 pixels, you simply multiply the 44 by the total number of bars that you have.
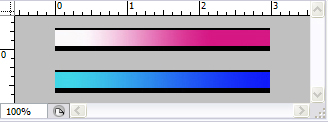
For the bars, I constructed two 215 pixel long, gradient filled in rectangles in Adobe Photoshop:
THE CSS FOR PLOTTING THE GRAPH
.horizontalgraph {
width: 253px;
position: relative;
background: url(images/bluegraph.jpg) repeat-y;
border-bottom: 1px solid #c0c0c0;
margin: 25px auto;
}

.horizontalgraph ul.bars {
margin: 0;
padding: 0;
/* getting rid of bullets */
list-style-type: none;

}
.horizontalgraph ul.bars li {
position: absolute;
left: 1px;
height: 21px;
padding: 0; margin: 0;
background: url(images/pinkbar2.jpg)
no-repeat;

border-right: 2px solid black;
padding-right: 3px;

text-align: right;
font-size: 12px;
letter-spacing: 0.1em;
font-weight: 800;
color: white;
}

.horizontalgraph ul.bars li.blue {
background: url(images/bluebar.jpg)
no-repeat;
}


/* bottom means 100% in background-position */
/* add 44 pixels for the next bar */
.horizontalgraph ul.bars li.bar1 { top: 11px; }
.horizontalgraph ul.bars li.bar2 { top: 55px; }
.horizontalgraph ul.bars li.bar3 { top: 99px; }
.horizontalgraph ul.bars li.bar4 { top: 143px; }
.horizontalgraph ul.bars li.bar5 { top: 187px; }
.horizontalgraph ul.bars li.bar6 { top: 231px; }
.horizontalgraph ul.bars li.bar7 { top: 275px; }
.horizontalgraph ul.bars li.bar8 { top: 319px; }
BLACK PENS FOR LABELING THE BARS
.horizontalgraph ul.bars li span {
color: black;
}

.horizontalgraph ul.bars li span.outside {
position: relative;
right: -30px;
color: black;
letter-spacing: normal;

display: block;
position: absolute;
right: -42px;
text-align: left;
width: 3em;
}
LABELING THE GRAPH AXIS
.horizontalgraph ul.ylabel {
padding: 0; margin: 0;
list-style-type: none;
position: absolute;
width: 100px;
left: -107px;
bottom: 0;
text-align: right;
}
.horizontalgraph ul.ylabel li {
height: 44px; line-height:44px;
text-transform: uppercase;
font-size: 11px;
letter-spacing: 0.1em; }

.horizontalgraph p {
position: absolute; left: 0; top: 100%;
margin: 8px 0 0 0; padding:0;
text-align: left;
width: 100%;
font-family: Verdana, sans-serif;
font-size: 10px; color: black;
line-height: 1.3em;
}

/* end of horizontal graph */
MARKUP FOR THE PINK GRAPH
<div class="horizontalgraph" style= "height: 176px;">
<ul class="bars">
<li class="bar1" style="width: 103px;">50</li>
<li class="bar2" style="width: 10px;"><span class="outside">3</span></li>
<li class="bar4" style="width: 67px;"><span>33</span></li>
<li class="bar3" style="width: 211px;">100</li>
</ul>
<ul class="ylabel">
<li>Japan</li><li>Romania</li><li>In a Galaxy Far Away</li><li>France</li>
</ul>
<p>Gross National Products of Countries in Dollars (GNP Per Capita unit times 1,000)
<br>ie Annually  $3,000/Person in Romania</p>
</div>
MARKUP FOR THE BLUE GRAPH
The markup for the graph is very similar to the vertical bar graphs we plotted before. The flexibility is the same: nothing is set in stone so we have control over how many bars we will have, the color of the bars is left upto the user and of course, the value which will determine how long each bar will be are all specified from the XHTML.
As shown above, the blue digital "graph paper" is 44 pixels deep so for the blue graph with 6 individual bars, I got 264 pixels for the height of the graph by multiplying 44 with 6.
<div class="horizontalgraph" style= "height: 264px;">
<ul class="bars">
<li class="bar1 blue" style="width: 103px;">50</li>
<li class="bar2 blue" style="width: 50px;">25</li>
<li class="bar3 blue" style="width: 154px;">75</li>
<li class="bar4 blue" style="width: 211px;">100</li>
<li class="bar5 blue" style="width: 32px;"><span class="outside">17</span></li>
<li class="bar6 blue" style="width: 103px;"><span class="outside">50</span></li>
</ul>
<ul class="ylabel">
<li>USA</li><li>Israel</li><li>Norway</li>
<li>Utopia</li><li>Morocco</li><li>Japan</li>
</ul>
<p>Gross National Products of Countries in Dollars
(GNP Per Capita units times 1,000)</p>
</div>

IMAGES USED IN MAKING THE GRAPH
To download the images on your machine, place mouse pointer on each image, right click mouse or touchpad and then choose save from the menu:


CREATING A RELATIVE PATH
Download the JPGs to your machine into a directory named images. The image files should be one level below your CSS/HTML files in a directory called images. This will allow the CSS to use the relative paths in the background statements.


4 comments:
not working. how do you prepare an article i really wonder. For example where are those bg images ? and i even removed bg images and still nothing is being show on the page.
P,
See section above for the images. To make the example work for you, download the JPGs to your machine into a directory called images. The image files should be one level below your CSS/HTML files in a directory called images. This allows the CSS to use relative paths.
With a relative path, the full absolute path to the file is determined by first taking the path to the current working directory then appending the relative path.
For example, if the current working directory is /home/user, and the relative path is images/dog.jpg, then the full path to the image is /home/user/images/dog.jpg. By including generic named relative paths in my CSS, I'm trying to avoid pigeon holing you into using my directory names.
How do you determine the pixel width value to get to a graph value? For example you have 103px for a graph value of 50 and 211px for a graph value of 100.
Thank you for your question.
A slice of my graph paper is 253 pixels wide but I don't want to use the last tile and I also will skip over the one pixel border on the left. (6 tiles - 1 pixel) = 216 pixels= 100%.
.horizontalgraph ul.bars li { border-right: 2px solid black; padding: 0 3px 0 0; }
In CSS, borders and padding are added to the final width of an element. I have 2 pixels for border and 3 pixels for right padding. 5+211= 216 pixels. So that's how I got the 211 width for 100%.
For 50%, I have 103px which becomes 108px with the addition of padding and border. 108 (50%) is half of 216 (100%).
Post a Comment
Note: Only a member of this blog may post a comment.